Analytics and Dashboard
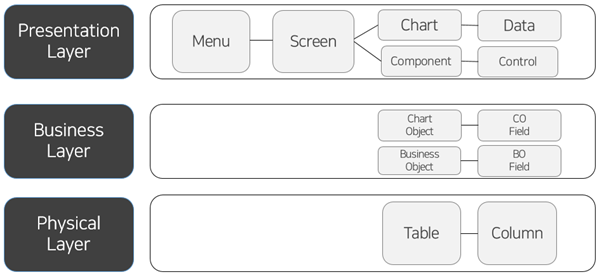
Cals provides Reports and Dashboards to present data generated from handling tasks in a meaningful way. For data analysis, data visualizations such as graphs, charts, and tables can be used. Dashboard, which facilitates easier monitoring and management of tasks, can be composed of aggregated form of data using Chart Objects and Chart Components.